No Escape - Mobile Hacking Lab Writeup
This is a challenge about Jailbreak-detect bypass.
Introduction
This is an iOS challenge focused on jailbreak detection bypass. The app is pretty straightforward: it detects if you're running it on a jailbroken device, shows a lock icon, and immediately closes. The goal? Bypass all these checks and get the flag.
Remember when I said in my Strings writeup that I wasn't crazy enough to open Ghidra? Well, I used Hopper this time. Still not that crazy, but we're getting there.
Reconnaissance
Initial Setup
First things first, I installed the IPA via TrollStore on my jailbroken iPhone. Then I set up my debugging environment:
-
Started
iproxyfor two ports:- Port 1234 for debugserver
- Port 2222 for SSH
- Both accessible via
localhost
-
In one terminal, I SSH'd into the device and started the debugserver:
debugserver '*:1234' --waitfor "No Escape"
-
Got the app name "No Escape" by running
frida-ps -Uawith the app open, which showed me the exact process name to wait for. -
Opened the app, which made the debugserver enter waiting mode.
Connecting LLDB
In my main terminal, I fired up LLDB:
lldb -o "process connect connect://localhost:1234"
Side note: my LLDB always shows this annoying warning: "libobjc.A.dylib is being read from process memory. This indicates that LLDB could not find the on-disk shared cache for this device. This will likely reduce debugging performance." I have no idea what this means, I just know it takes forever to start LLDB and it stresses me out.
Reverse Engineering
Finding the Jailbreak Check Function
The simplest approach was using LLDB's image lookup to find jailbreak-related functions:
(lldb) image lookup -r -n "Jailbroken"
1 match found in /private/var/containers/Bundle/Application/5E15B961-AB72-4C27-8F82-6F5B75138083/No Escape.app/No Escape:
        Address: No Escape[0x000000010000a068] (No Escape.__TEXT.__text + 24680)
        Summary: No Escape`No_Escape.isJailbroken() -> Swift.Bool
Bingo! Found the isJailbroken() function. Now let's set a breakpoint on it:
br s -n No_Escape.isJailbroken
Analyzing the Function
After setting the breakpoint, I tried to disassemble but got an error (process wasn't stopped yet). So I continued execution with c to hit my breakpoint, then ran disas again:
(lldb) disas
error: Cannot disassemble around the current function without the process being stopped.
Process 39340 stopped
* thread #1, queue = 'com.apple.main-thread', stop reason = breakpoint 1.1
    frame #0: 0x000000010031e068 No Escape`isJailbroken()
No Escape`isJailbroken:
->  0x10031e068 <+0>:  sub    sp, sp, #0x20
    0x10031e06c <+4>:  stp    x29, x30, [sp, #0x10]
    0x10031e070 <+8>:  add    x29, sp, #0x10
    0x10031e074 <+12>: bl     0x10031e118    ; No_Escape.checkForJailbreakFiles() -> Swift.Bool
I did a register read and ran disas again, and suddenly got more complete output (not sure why it didn't load properly the first time):
(lldb) disas
No Escape`isJailbroken:
->  0x10031e068 <+0>:   sub    sp, sp, #0x20
    0x10031e06c <+4>:   stp    x29, x30, [sp, #0x10]
    0x10031e070 <+8>:   add    x29, sp, #0x10
    0x10031e074 <+12>:  bl     0x10031e118    ; No_Escape.checkForJailbreakFiles() -> Swift.Bool
    0x10031e078 <+16>:  tbz    w0, #0x0, 0x10031e08c ; <+36>
    0x10031e07c <+20>:  b      0x10031e080    ; <+24>
    0x10031e080 <+24>:  mov    w0, #0x1 ; =1
    0x10031e084 <+28>:  stur   w0, [x29, #-0x4]
    0x10031e088 <+32>:  b      0x10031e098    ; <+48>
    0x10031e08c <+36>:  bl     0x10031e3fc    ; No_Escape.checkForWritableSystemDirectories() -> Swift.Bool
    0x10031e090 <+40>:  stur   w0, [x29, #-0x4]
    0x10031e094 <+44>:  b      0x10031e098    ; <+48>
    0x10031e098 <+48>:  ldur   w8, [x29, #-0x4]
    0x10031e09c <+52>:  tbz    w8, #0x0, 0x10031e0b0 ; <+72>
    0x10031e0a0 <+56>:  b      0x10031e0a4    ; <+60>
    0x10031e0a4 <+60>:  mov    w0, #0x1 ; =1
    0x10031e0a8 <+64>:  str    w0, [sp, #0x8]
    0x10031e0ac <+68>:  b      0x10031e0bc    ; <+84>
    0x10031e0b0 <+72>:  bl     0x10031e6fc    ; No_Escape.canOpenCydia() -> Swift.Bool
    0x10031e0b4 <+76>:  str    w0, [sp, #0x8]
    0x10031e0b8 <+80>:  b      0x10031e0bc    ; <+84>
    0x10031e0bc <+84>:  ldr    w8, [sp, #0x8]
    0x10031e0c0 <+88>:  tbz    w8, #0x0, 0x10031e0d4 ; <+108>
    0x10031e0c4 <+92>:  b      0x10031e0c8    ; <+96>
    0x10031e0c8 <+96>:  mov    w0, #0x1 ; =1
    0x10031e0cc <+100>: str    w0, [sp, #0x4]
    0x10031e0d0 <+104>: b      0x10031e0e0    ; <+120>
    0x10031e0d4 <+108>: bl     0x10031e940    ; No_Escape.checkSandboxViolation() -> Swift.Bool
    0x10031e0d8 <+112>: str    w0, [sp, #0x4]
    0x10031e0dc <+116>: b      0x10031e0e0    ; <+120>
    0x10031e0e0 <+120>: ldr    w8, [sp, #0x4]
    0x10031e0e4 <+124>: tbz    w8, #0x0, 0x10031e0f8 ; <+144>
    0x10031e0e8 <+128>: b      0x10031e0ec    ; <+132>
    0x10031e0ec <+132>: mov    w8, #0x1 ; =1
    0x10031e0f0 <+136>: str    w8, [sp]
    0x10031e0f4 <+140>: b      0x10031e104    ; <+156>
    0x10031e0f8 <+144>: mov    w8, #0x0 ; =0
    0x10031e0fc <+148>: str    w8, [sp]
    0x10031e100 <+152>: b      0x10031e104    ; <+156>
    0x10031e104 <+156>: ldr    w8, [sp]
    0x10031e108 <+160>: and    w0, w8, #0x1
    0x10031e10c <+164>: ldp    x29, x30, [sp, #0x10]
    0x10031e110 <+168>: add    sp, sp, #0x20
    0x10031e114 <+172>: ret
Understanding the Jailbreak Checks
Now we can see the full picture! The function performs multiple checks:
- checkForJailbreakFiles() - Looks for common jailbreak files
- checkForWritableSystemDirectories() - Tries to write to system directories
- canOpenCydia() - Attempts to open the Cydia app
- checkSandboxViolation() - Checks for sandbox escapes
Each check stores either 1 (jailbroken/true) or 0 (not jailbroken/false) in registers. The function does multiple tbz (test bit and branch if zero) instructions to chain these checks together.
The key insight: instead of patching all these individual checks, we can just modify the final return value in the x0 register. Since we want the function to return false (no jailbreak detected), we need x0 to be 0.
Exploitation
Approach 1: Direct Function Bypass
The simplest method - find the function and patch its return value.
- Set a breakpoint at the return instruction:
br s -a 0x10031e114
- Continue execution:
c
- Check the register value:
(lldb) register read
General Purpose Registers:
        x0 = 0x0000000000000001
As expected, x0 contains 1 (jailbreak detected).
- Change it to
0:
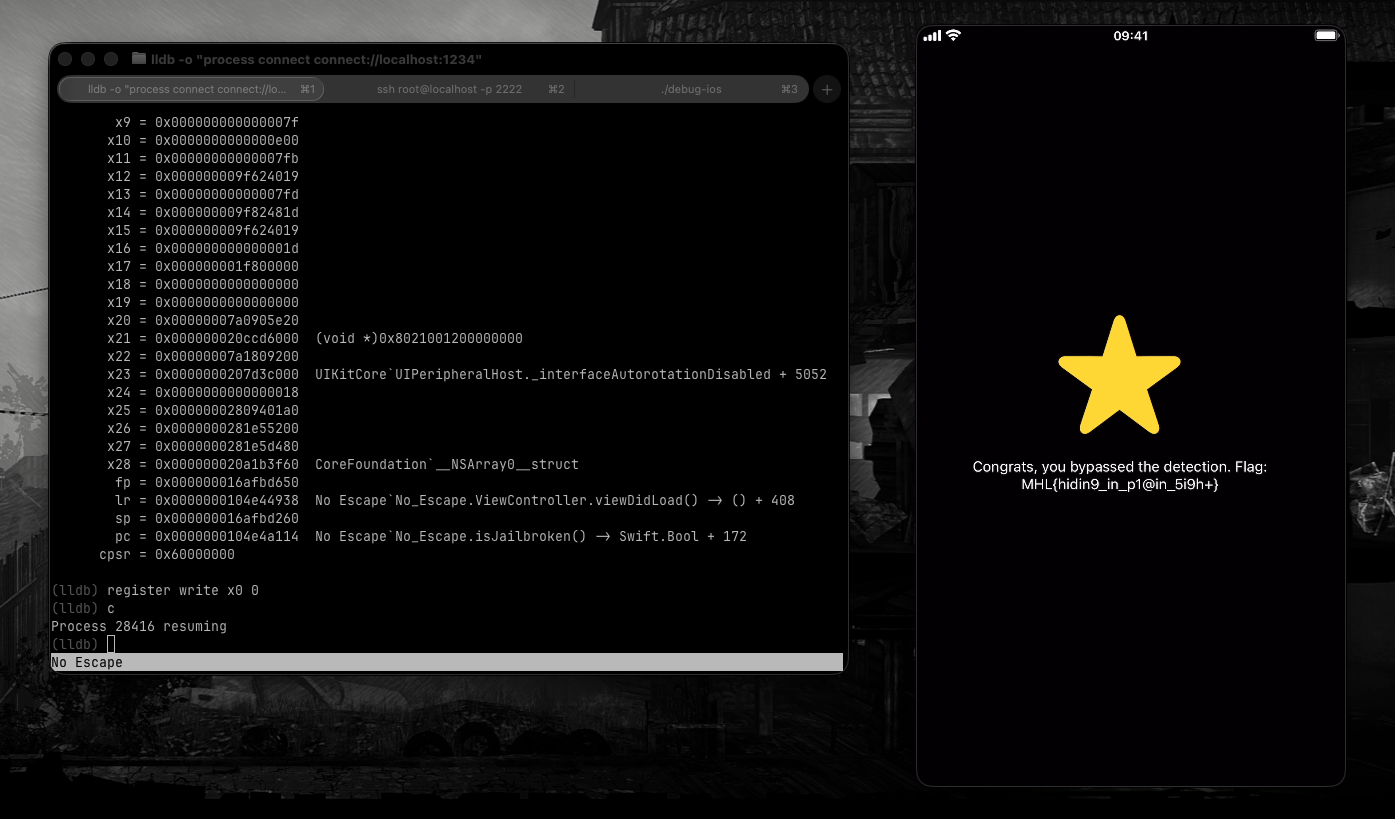
register write x0 0
- Continue execution:
c
But wait... the breakpoint hit again! The function was called a second time. No problem, just repeat the process:
Process 39340 stopped
* thread #1, queue = 'com.apple.main-thread', stop reason = breakpoint 1.1
    frame #0: 0x000000010031e068 No Escape`isJailbroken()
Changed x0 to 0 again, continued, and... boom!
Approach 2: Calculating ASLR Offset with Hopper
This approach uses a disassembler to find the function offset, then calculates the correct address accounting for ASLR (Address Space Layout Randomization).
Step 1: Find the Function Offset
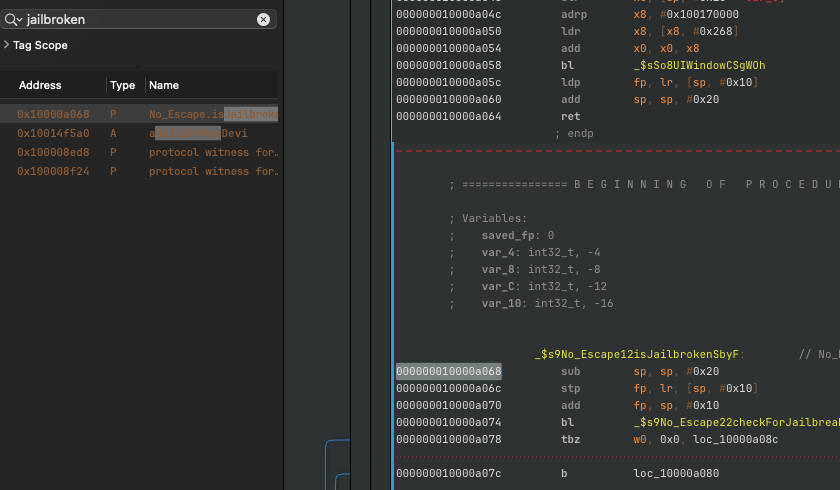
I opened the binary in Hopper Disassembler (could also use Ghidra) and searched for "jailbroken". Found the isJailbroken function at offset 0x000000010000a068.
Step 2: Calculate ASLR Slide
ASLR randomizes where the binary loads in memory, so we need to calculate the actual runtime address. First, dump the sections:
(lldb) image dump sections "No Escape"
Sections for '/private/var/containers/Bundle/Application/5E15B961-AB72-4C27-8F82-6F5B75138083/No Escape.app/No Escape(0x0000000104478000)' (arm64):
  SectID             Type                   Load Address                             Perm File Off.  File Size  Flags      Section Name
  ------------------ ---------------------- ---------------------------------------  ---- ---------- ---------- ---------- ----------------------------
  0x0000000000000100 container              [0x0000000000000000-0x0000000100000000)* ---  0x00000000 0x00000000 0x00000000 No Escape.__PAGEZERO
  0x0000000000000200 container              [0x0000000104478000-0x00000001045dc000)  r-x  0x00000000 0x00164000 0x00000000 No Escape.__TEXT
The important values here are:
__PAGEZEROends at:0x0000000100000000(binary's base address)__TEXTstarts at:0x0000000104478000(where it actually loaded)
Calculate the ASLR slide:
(lldb) p/x 0x0000000104478000 - 0x0000000100000000
(long) 0x0000000004478000
This slide value (0x0000000004478000) is the offset between where the binary should load and where it actually loaded due to ASLR.
Step 3: Calculate Function Address
Now add the slide to our function offset from Hopper:
(lldb) p/x 0x0000000004478000 + 0x000000010000a068
(long) 0x0000000104482068
Step 4: Set Breakpoint and Patch
br s -a 0x0000000104482068
This creates a breakpoint at the correct runtime address:
Breakpoint 4: where = No Escape`isJailbroken(), address = 0x0000000104482068
From here, the process is identical to Approach 1:
- Continue execution (
c) - Hit the breakpoint
disasto see where we are- Set breakpoint at return (
br s -a <return_address>) - Patch
x0register to0 - Continue twice (function is called twice)
- Get the flag!
Conclusion
This challenge was a solid exercise in:
- iOS debugging with LLDB and debugserver (went full manual mode instead of using Frida like they suggested)
- Understanding ARM64 assembly and calling conventions
- ASLR and runtime address calculation
- Dynamic analysis and register manipulation
- Multiple jailbreak detection techniques:
- File-based detection
- System directory write tests
- URL scheme checks (Cydia)
- Sandbox violation detection
The key takeaway: Understanding the function's control flow helps you find the most efficient bypass point.
Also, I finally used a disassembler for iOS reversing. Progress!