Captain Nohook - Mobile Hacking Lab Writeup
An iOS challenge focused on bypassing multiple anti-debugging and anti-reverse engineering protections. The goal is to defeat all detection mechanisms and retrieve the hidden flag.
Introduction
This challenge is about an iOS app called "Captain Nohook" that implements several anti-debugging and jailbreak detection mechanisms. The goal is to bypass all these protections and retrieve the hidden flag.
When you tap the button to get the flag, the app just shows "Noncompliant device detected!" and exits. Time to work around that.
Reconnaissance
Initial Setup
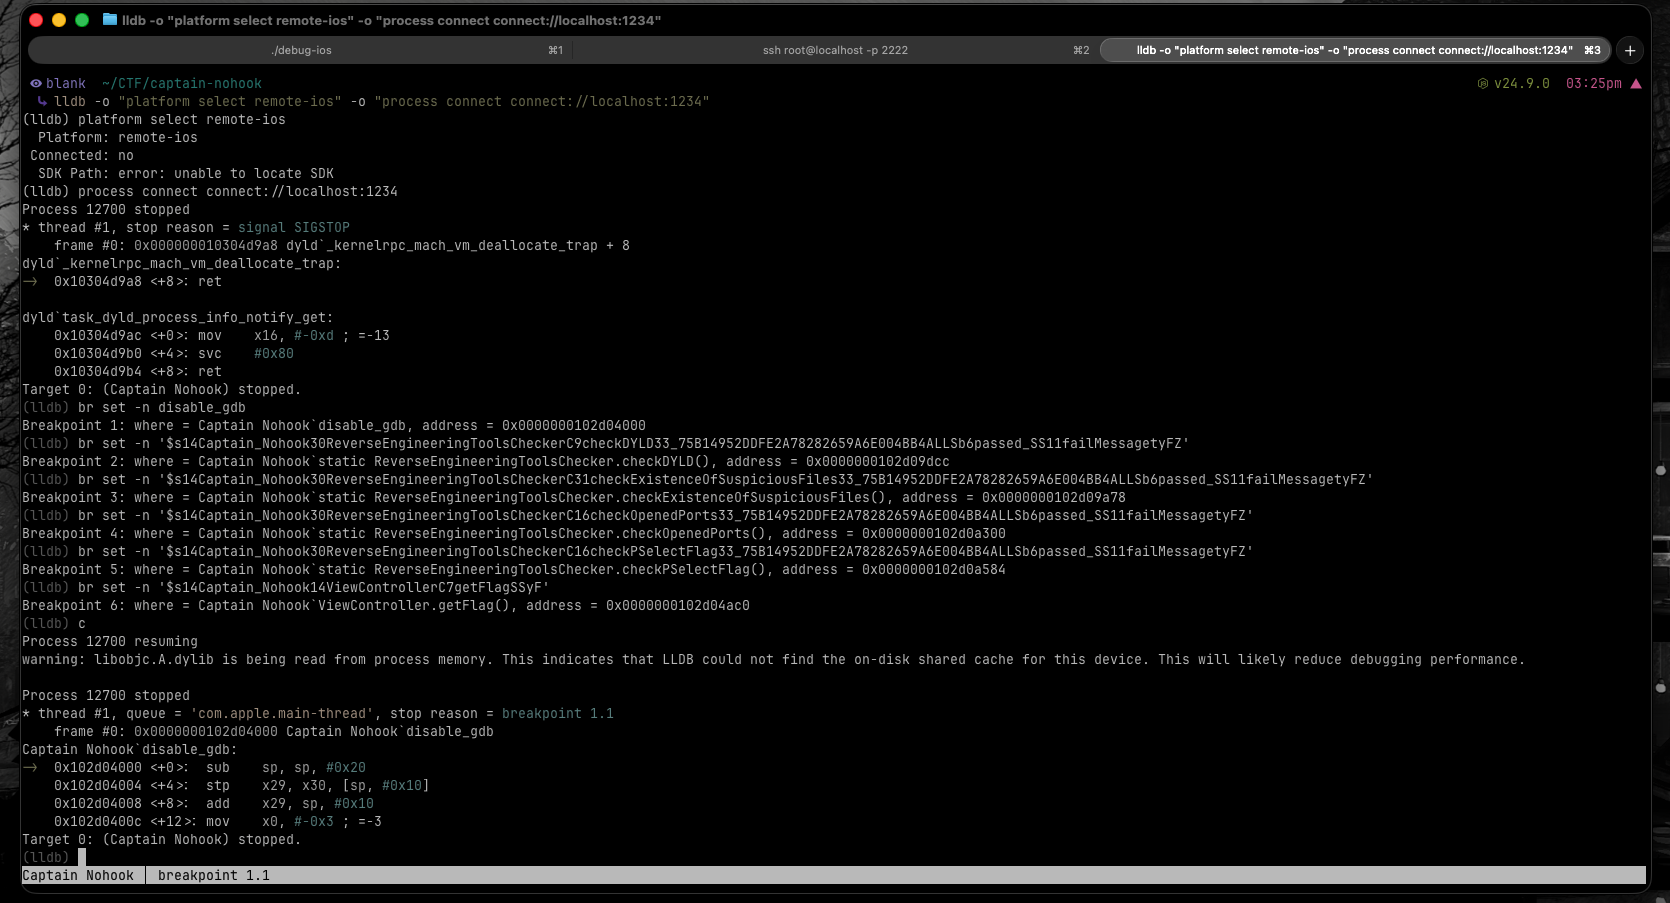
First, I needed to connect to my jailbroken iPhone. Using debugserver on the device and LLDB on my Mac:
lldb -o "platform select remote-ios" -o "process connect connect://localhost:1234"
This connected to the debugserver (running on port 1234) and attached to the running Captain Nohook process (PID 14365).
Finding the Symbols
To know where to set breakpoints, I extracted the binary from the IPA and analyzed its symbols. After unzipping the IPA file, I used nm to list all symbols from the Mach-O binary:
nm "extracted/Payload/Captain Nohook.app/Captain Nohook"
The nm command dumps all symbols (functions, variables, etc.) from the binary. The output is massive, so I had to grep through it looking for interesting patterns. The challenge here is that Swift mangles its function names, turning them into cryptic strings that encode type information.
I searched for keywords that might be relevant based on the app's behavior:
nm "extracted/Payload/Captain Nohook.app/Captain Nohook" | grep "disable_gdb"
nm "extracted/Payload/Captain Nohook.app/Captain Nohook" | grep "ReverseEngineering"
nm "extracted/Payload/Captain Nohook.app/Captain Nohook" | grep "getFlag"
(Yeah, Hopper would've made this way easier, but I had just learned about nm and wanted to practice it in the most impractical way possible.)
After going through the results and understanding the Swift name mangling pattern, I identified the functions I needed to target:
_disable_gdb
_$s14Captain_Nohook30ReverseEngineeringToolsCheckerC9checkDYLD33_75B14952DDFE2A78282659A6E004BB4ALLSb6passed_SS11failMessagetyFZ
_$s14Captain_Nohook30ReverseEngineeringToolsCheckerC31checkExistenceOfSuspiciousFiles33_75B14952DDFE2A78282659A6E004BB4ALLSb6passed_SS11failMessagetyFZ
_$s14Captain_Nohook30ReverseEngineeringToolsCheckerC16checkOpenedPorts33_75B14952DDFE2A78282659A6E004BB4ALLSb6passed_SS11failMessagetyFZ
_$s14Captain_Nohook30ReverseEngineeringToolsCheckerC16checkPSelectFlag33_75B14952DDFE2A78282659A6E004BB4ALLSb6passed_SS11failMessagetyFZ
_$s14Captain_Nohook14ViewControllerC7getFlagSSyF
The key was looking for the ReverseEngineeringToolsChecker class and understanding which methods were likely doing the actual checks (like checkDYLD, checkOpenedPorts, etc.). The mangled names are ugly, but once you understand the pattern, you can decode what each function does.
Now I had the exact symbol names to target:
disable_gdb- Classic ptrace anti-debuggingcheckExistenceOfSuspiciousFiles- Looks for jailbreak artifactscheckDYLD- Checks DYLD environment variablescheckOpenedPorts- Detects debugserver's open portcheckPSelectFlag- Verifies process flagsgetFlag- The function that returns our prize
Reverse Engineering
Understanding Swift Name Mangling
Swift mangles its symbols to encode type information in the function name. Breaking down one of them:
$s14Captain_Nohook30ReverseEngineeringToolsCheckerC9checkDYLD...
$s= Swift symbol14Captain_Nohook= module name (14 characters)30ReverseEngineeringToolsChecker= class name (30 characters)C= Class9checkDYLD= method name (9 characters)
The important part: all these check functions return a tuple (passed: Bool, failMessage: String).
ARM64 Return Values
In ARM64, function return values go in specific registers:
- x0 = first return value (our Bool: 0 = false, 1 = true)
- x1 = second return value (the String)
So if I wanted to bypass a check, I just needed to make sure x0 = 1 after the function returns.
Exploitation
Setting Up Breakpoints
Using the symbols found earlier, I set breakpoints on all the protection functions:
(lldb) br set -n disable_gdb
Breakpoint 1: where = Captain Nohook`disable_gdb, address = 0x0000000104718000

(lldb) br set -n '$s14Captain_Nohook30ReverseEngineeringToolsCheckerC31checkExistenceOfSuspiciousFiles33_75B14952DDFE2A78282659A6E004BB4ALLSb6passed_SS11failMessagetyFZ'
Breakpoint 3: where = Captain Nohook`static ReverseEngineeringToolsChecker.checkExistenceOfSuspiciousFiles()

(lldb) br set -n '$s14Captain_Nohook30ReverseEngineeringToolsCheckerC9checkDYLD33_75B14952DDFE2A78282659A6E004BB4ALLSb6passed_SS11failMessagetyFZ'
Breakpoint 2: where = Captain Nohook`static ReverseEngineeringToolsChecker.checkDYLD()

(lldb) br set -n '$s14Captain_Nohook30ReverseEngineeringToolsCheckerC16checkOpenedPorts33_75B14952DDFE2A78282659A6E004BB4ALLSb6passed_SS11failMessagetyFZ'
Breakpoint 4: where = Captain Nohook`static ReverseEngineeringToolsChecker.checkOpenedPorts()

(lldb) br set -n '$s14Captain_Nohook30ReverseEngineeringToolsCheckerC16checkPSelectFlag33_75B14952DDFE2A78282659A6E004BB4ALLSb6passed_SS11failMessagetyFZ'
Breakpoint 5: where = Captain Nohook`static ReverseEngineeringToolsChecker.checkPSelectFlag()

(lldb) br set -n '$s14Captain_Nohook14ViewControllerC7getFlagSSyF'
Breakpoint 6: where = Captain Nohook`ViewController.getFlag()
Bypass Strategy
My approach:
- Let the app run until it hits a breakpoint
- Use
finishto execute the function completely - Check the return value in register x0
- If it failed (x0 = 0), patch it to success (x0 = 1)
- Continue execution
Bypass #1: disable_gdb
(lldb) c
Process 14365 resuming

Process 14365 stopped
* thread #1, queue = 'com.apple.main-thread', stop reason = breakpoint 1.1
    frame #0: 0x0000000104718000 Captain Nohook`disable_gdb
Captain Nohook`disable_gdb:
->  0x104718000 <+0>:  sub    sp, sp, #0x20
    0x104718004 <+4>:  stp    x29, x30, [sp, #0x10]
    0x104718008 <+8>:  add    x29, sp, #0x10
    0x10471800c <+12>: mov    x0, #-0x3 ; =-3
This is the first and most critical bypass. The disable_gdb function calls ptrace(PT_DENY_ATTACH, ...) which would normally kill the app when a debugger is attached. If I let this function execute, the app crashes immediately.
The solution: force an early return before the ptrace call happens:
(lldb) thread return 0
* thread #1, queue = 'com.apple.main-thread', stop reason = breakpoint 1.1
    frame #0: 0x0000000104718914 Captain Nohook`ViewController.viewDidLoad() + 304
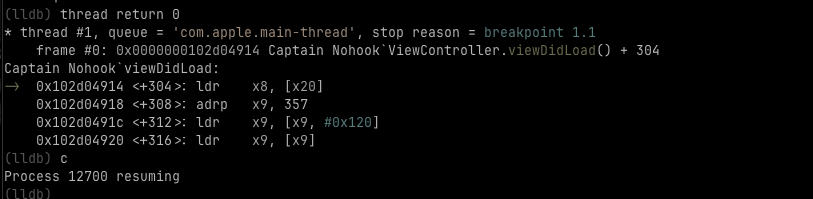
The thread return command skips the rest of the function and returns immediately with the value 0. This prevents the ptrace call from ever executing, allowing the debugger to stay attached without crashing the app.

Bypass #2: checkExistenceOfSuspiciousFiles
(lldb) c
Process 14365 resuming

Process 14365 stopped
* thread #1, queue = 'com.apple.main-thread', stop reason = breakpoint 6.1
    frame #0: 0x0000000104718ac0 Captain Nohook`ViewController.getFlag()

(lldb) finish
Process 14365 stopped
* thread #1, queue = 'com.apple.main-thread', stop reason = breakpoint 3.1
    frame #0: 0x000000010471da78 Captain Nohook`static ReverseEngineeringToolsChecker.checkExistenceOfSuspiciousFiles()

(lldb) finish
Process 14365 stopped

(lldb) reg r
General Purpose Registers:
        x0 = 0x0000000000000000
        x1 = 0xf00000000000002d
        ...
The check failed (x0 = 0) - it found suspicious files. Time to patch:
(lldb) reg w x0 1
(lldb) c
Bypass #3: checkDYLD
Process 14365 stopped
* thread #1, queue = 'com.apple.main-thread', stop reason = breakpoint 2.1
    frame #0: 0x000000010471ddcc Captain Nohook`static ReverseEngineeringToolsChecker.checkDYLD()

(lldb) finish
(lldb) reg r
        x0 = 0x0000000000000001
        x1 = 0x0000000000000000
        ...
(lldb) c
This one passed naturally (x0 = 1). No patching needed.
Bypass #4: checkOpenedPorts
Process 14365 stopped
* thread #1, queue = 'com.apple.main-thread', stop reason = breakpoint 4.1
    frame #0: 0x000000010471e300 Captain Nohook`static ReverseEngineeringToolsChecker.checkOpenedPorts()

(lldb) finish
(lldb) reg r
        x0 = 0x0000000000000000
        x1 = 0xf000000000000012
        ...
Failed - it detected debugserver's port. Patching:
(lldb) reg w x0 1
(lldb) c
Bypass #5: checkPSelectFlag
Process 14365 stopped
* thread #1, queue = 'com.apple.main-thread', stop reason = breakpoint 5.1
    frame #0: 0x000000010471e584 Captain Nohook`static ReverseEngineeringToolsChecker.checkPSelectFlag()

(lldb) finish
(lldb) reg r
        x0 = 0x0000000000000001
        x1 = 0x0000000000000000
        ...
(lldb) c
Another natural pass.
Getting the Flag
After tapping the "Flag 'ere!" button and bypassing all checks, the app showed a "Success!" message. But where's the actual flag?
The getFlag() function loaded a native library, so the flag is probably somewhere in memory. Time for memory scanning.
The memory range 0x280000000 to 0x284000000 is where iOS typically maps heap memory for the app process. This range covers approximately 64MB of heap space where dynamically allocated objects (like strings, loaded libraries, and runtime data) reside. Since the flag was likely loaded into memory by the native library, searching this heap region made sense.
(lldb) memory find -s "MHL{" -- 0x280000000 0x284000000
data found at location: 0x2825fbab1
0x2825fbab1: 4d 48 4c 7b 48 30 30 6b 5f 31 6e 5f 59 30 75 72  MHL{H00k_1n_Y0ur
0x2825fbac1: 5f 44 33 62 55 67 67 33 72 7d 0a 00 00 00 00 00  _D3bUgg3r}......
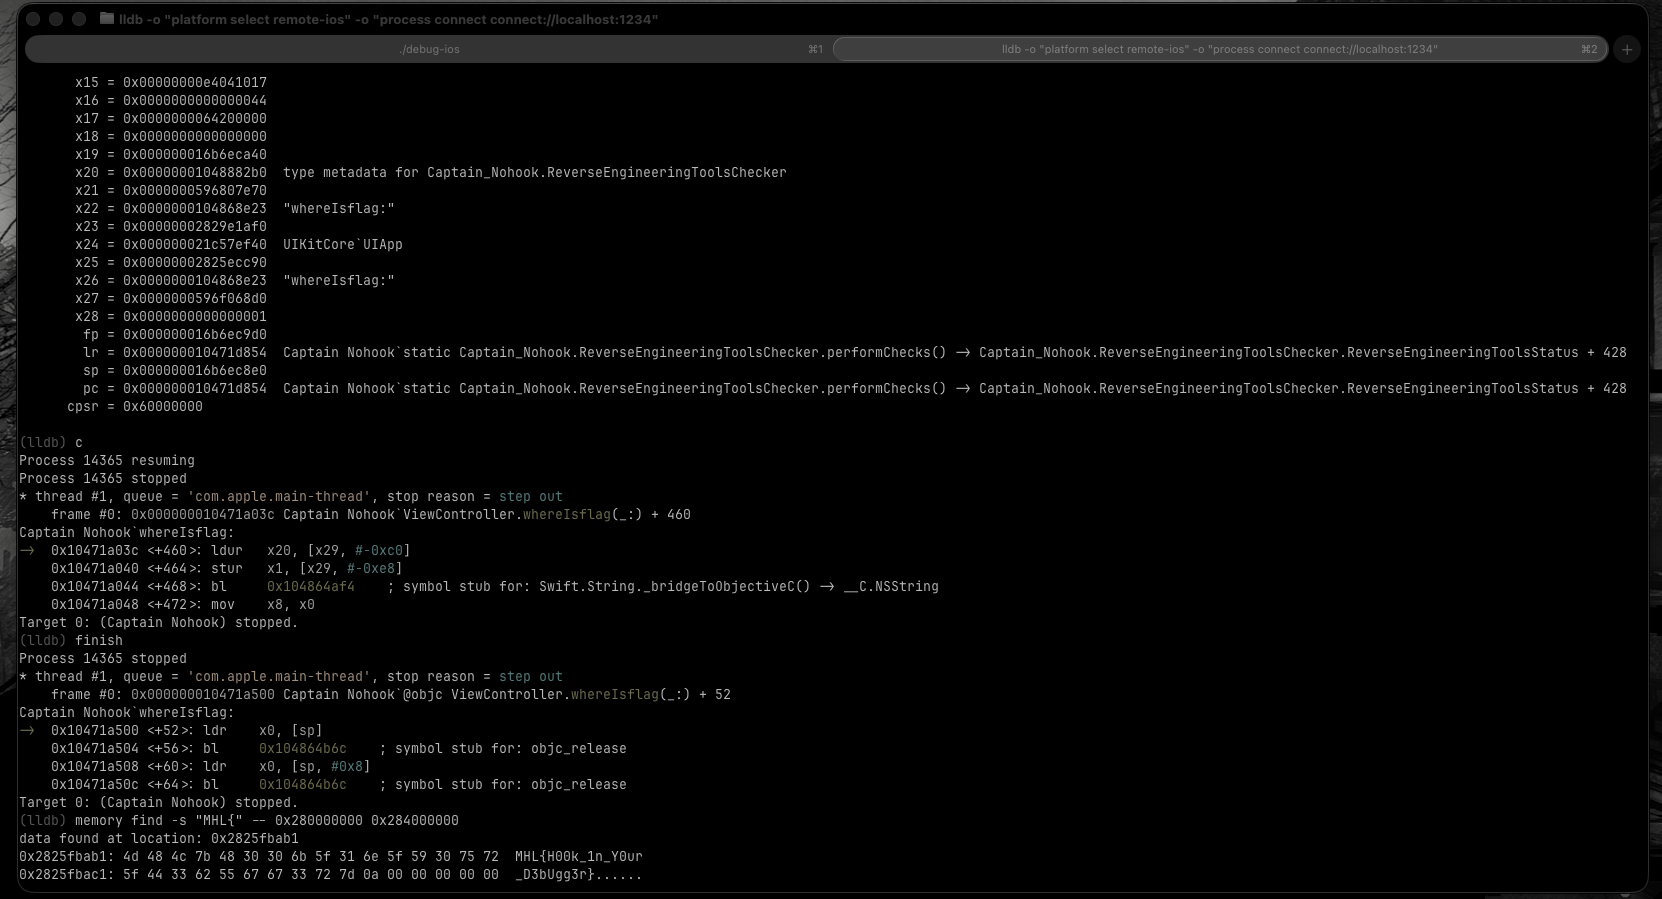
The memory find command searches through the specified memory range for the given string pattern. The -s flag tells it to search for a string, and the -- separates the search pattern from the memory range arguments.
FLAG: MHL{H00k_1n_Y0ur_D3bUgg3r}
Conclusion
This challenge was a solid exercise in:
- iOS remote debugging with LLDB and debugserver
- Swift reverse engineering and understanding name mangling
- ARM64 calling conventions and register manipulation
- Runtime patching of return values
- Memory forensics and understanding iOS process memory layout
The key insight was understanding that Swift's Bool return values are just integers in x0, making them easy to patch at runtime. Each check function could be bypassed by simply changing its return value from 0 to 1.
The most critical part was the initial disable_gdb bypass using thread return. Without this, the app would crash immediately upon detecting the debugger, making all other bypasses impossible. This is a common anti-debugging technique in iOS apps and understanding how to bypass it is essential for any iOS reverse engineering work.
Worth noting: this lab doesn't specifically require LLDB - most people solve it with Frida. I chose LLDB because it gives more direct control over the process and helps understand what's happening at a lower level. It's more manual work, but you learn way more about ARM64, calling conventions, and how iOS apps actually work under the hood.